research
My research is kindly supported by NSF grant DMS-2210064 and NIH grant R03EB033001.
Integration of complex imaging data and high-dimensional data
We develop tools for the integrative analysis of complex imaging data. For instance, in our work [1], we developed a novel canonical correlation model that enables the integration of imaging and high-dimensional data. We applied this model to data from the Human Connectome Project to explore the dependence structure between each subject’s dynamic functional connectivity—represented by a temporally indexed collection of functional brain networks—and high-dimensional data representing lifestyle, demographic, and psychometric measures.
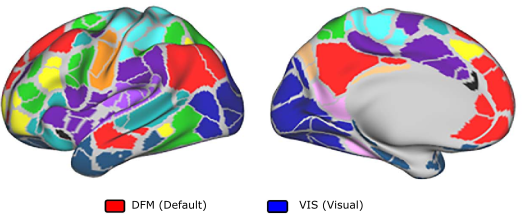
In Figure 1 below, we illustrate the parcellation used to define the functional networks. For each pair of regions and for every subject, we compute functional connectivity based on the correlation between the associated fMRI time-series, employing sliding windows to generate dynamic networks.

In Figure 2 below (animation), we present the estimated joint mode of variation between dynamic connectivity and the behavioral features selected by the model. The model identifies a non-stationary connectivity pattern — particularly between the Default Mode Network (DFM) and the Visual Cortex (VIS) — that appears to be strongly correlated with behavioral variables. The scrollbar allows you to explore the identified cross-sectional connectivity/behaviour joint mode of variation.
A multimodal model for studying functional connectivity and brain morphology, while accounting for genetic factors, was proposed in [2].
Reference:
[1] Buenfil, Lila (2025). “Asymmetric Canonical Correlation Analysis of Riemannian and High-Dimensional Data”, Electronic Journal of Statistics. http://arxiv.org/abs/2404.11781.
[2] Lila, Aston (2022) ‘Functional random effects modeling of brain shape and connectivity’, Annals of Applied Statistics, 16(4). https://doi.org/10.1214/21-AOAS1572.
Intepretable classification models
In our work [3], we propose an interpretable classification model that leverages cortical morphology and thickness to classify patients into Alzheimer’s Disease (AD) and Control groups. The proposed model generates interpretable rules, as shown in the figure below, highlighting cortical shape and thickness features associated with AD.
Reference:
[3] Lila, Zhang, Rane Levendovszky (2024) “Interpretable discriminant analysis for functional data supported on random nonlinear domains with an application to Alzheimer’s disease”, Journal of the Royal Statistical Society Series B: Statistical Methodology, https://doi.org/10.1093/jrsssb/qkae023.